From Plant Floor to Cloud: How to Monitor Industrial Data in Real Time Without an Expensive Historian
Your machines have been talking all shift. The question is whether anyone is listening.
Walk any plant floor and you'll find equipment generating data every second of every day — temperatures, pressures, flow rates, cycle counts, motor currents. The sensors are already there. The PLCs are already logging. And yet, in a surprising number of facilities, the way that data actually reaches a human being is a clipboard, a manual OEE spreadsheet filled in at end of shift, or a historian license that costs more than the line it monitors.
The data isn't the problem. Getting it out — and making it useful — is. This is the gap nobody talks about, and closing it is the first real step toward everything people mean when they say "Industry 4.0."
The gap nobody talks about
Here's the uncomfortable truth most operations teams live with: the data exists, but it's trapped. It sits in the PLC, in the SCADA tag database, in a format built for control, not for analysis. To see it, you either stand in front of the HMI, or you pay for a heavyweight historian and the specialists to run it.
For large enterprises, that's an accepted cost of doing business. For small-to-mid manufacturers, system integrators, and the plant engineers who actually own the outcome, it's often a wall. You know the data would help. You just can't justify a six-figure platform to read your own sensors.
So the data keeps flowing, and nobody reads it in time to act.
What "plant floor to cloud" actually means
Strip away the buzzwords and the journey is simple:
PLC or sensor → OPC UA server → cloud database → dashboard.
That's it. Your equipment exposes its values through an OPC UA server. A lightweight service subscribes to those values and streams them to a database in the cloud. A dashboard reads from that database so you — or anyone you trust — can see what's happening from anywhere. That path, and where each piece belongs, is the subject of my OT to cloud architecture guide.
OPC UA in one paragraph: it's the standard protocol every major industrial vendor supports — Siemens, Rockwell, Schneider, and the rest. It's the agreed-upon way for industrial equipment to expose its data securely and consistently. If your equipment is reasonably modern, it almost certainly speaks OPC UA already. That's the door. You don't have to build it; you just have to walk through it.
Why cloud storage changes the game: once the data lives in a cloud database, you stop being tied to a screen in the control room. You can check a line from your phone at home. You don't need to buy and maintain an on-site server. And the storage scales with you — start with one line, grow to the whole plant, without re-architecting anything.
The traditional approach vs. the modern approach
For decades, the answer to "I need to store and trend my plant data" was a dedicated historian — OSIsoft PI, AVEVA Wonderware, and their peers. They are genuinely capable products. They are also priced for plants that can absorb licensing, servers, and the expertise to keep them running.
The modern alternative is an open stack: a standard protocol (OPC UA), a general-purpose database, and a dashboard layer — assembled into something that does the core job of a historian without the licensing model.
| Traditional historian | Open-stack approach | |
|---|---|---|
| Cost | High licensing, per-tag fees | No licensing fees |
| Hosting | On-site servers | Runs on any PC or cloud |
| Lock-in | Vendor-specific | Standard protocols, portable |
| Setup | Specialist integration | Connect and browse |
| Best for | Large enterprises | SMBs, integrators, plant engineers |
This isn't an argument that historians are bad. It's an argument that for a large and underserved part of the market, they're the wrong tool — and that there's now a real alternative for the small-to-mid manufacturer, the system integrator building for clients, and the plant engineer who wants control over their own data without filing a capital request.
What the platform does
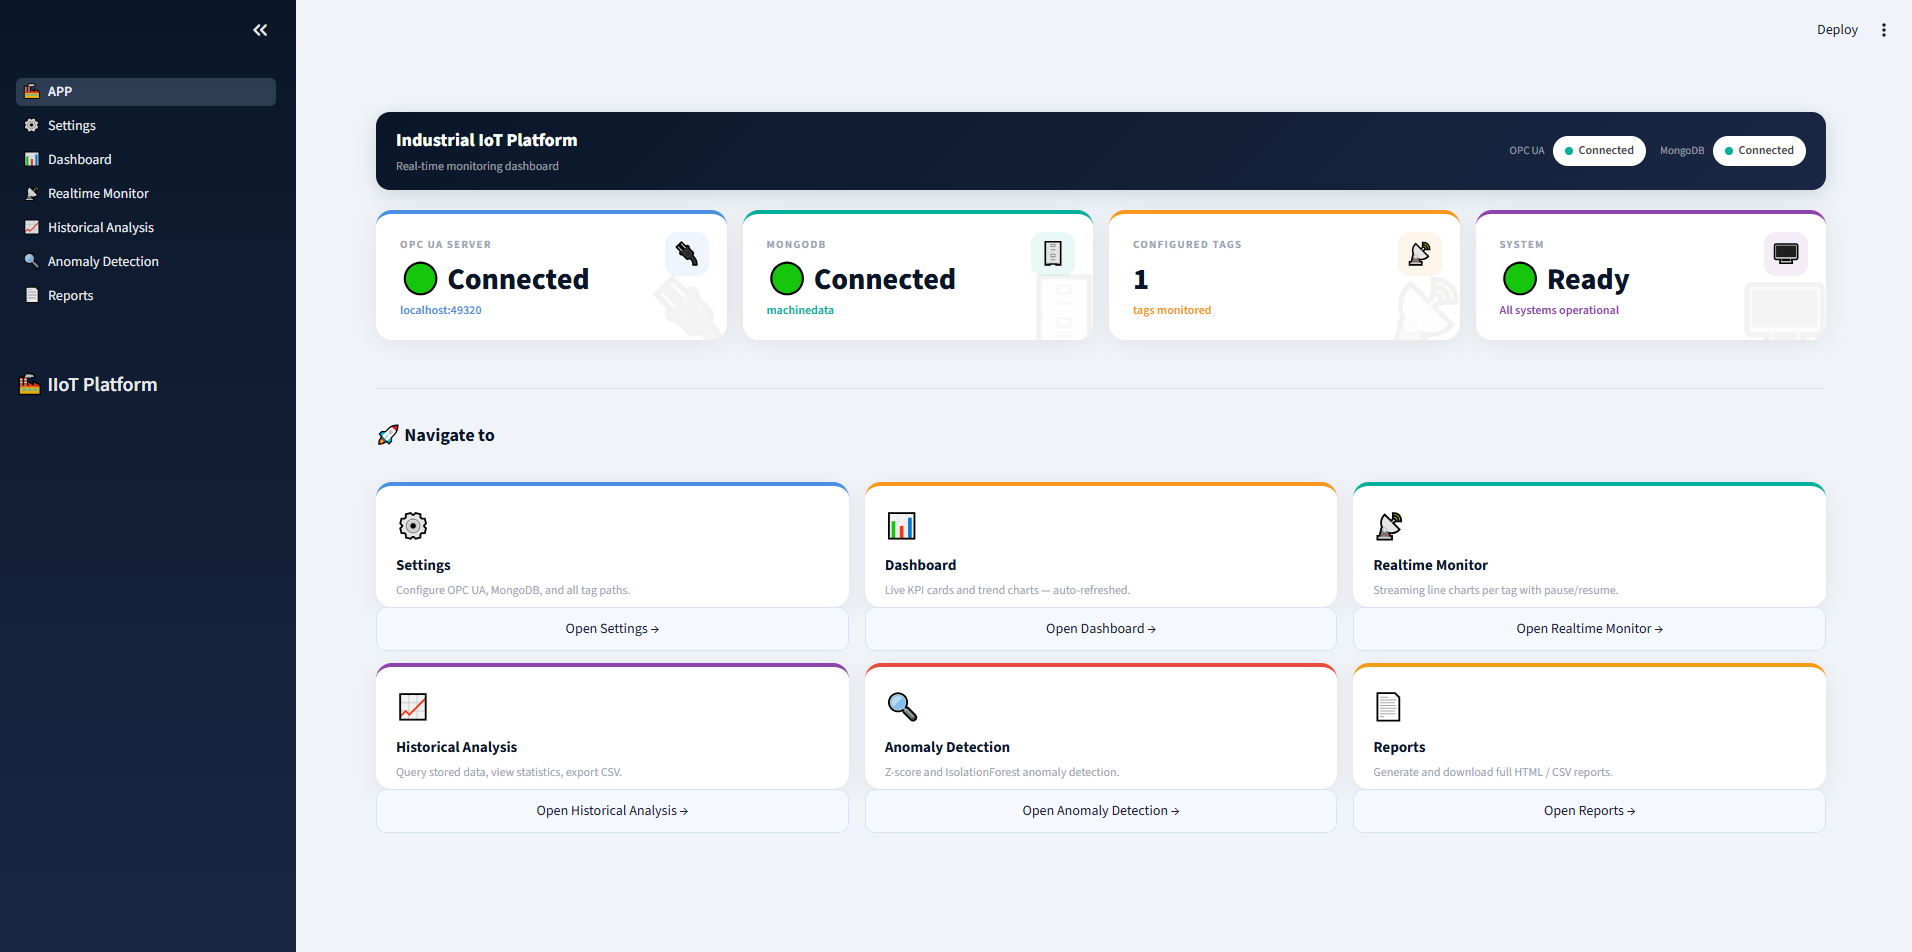
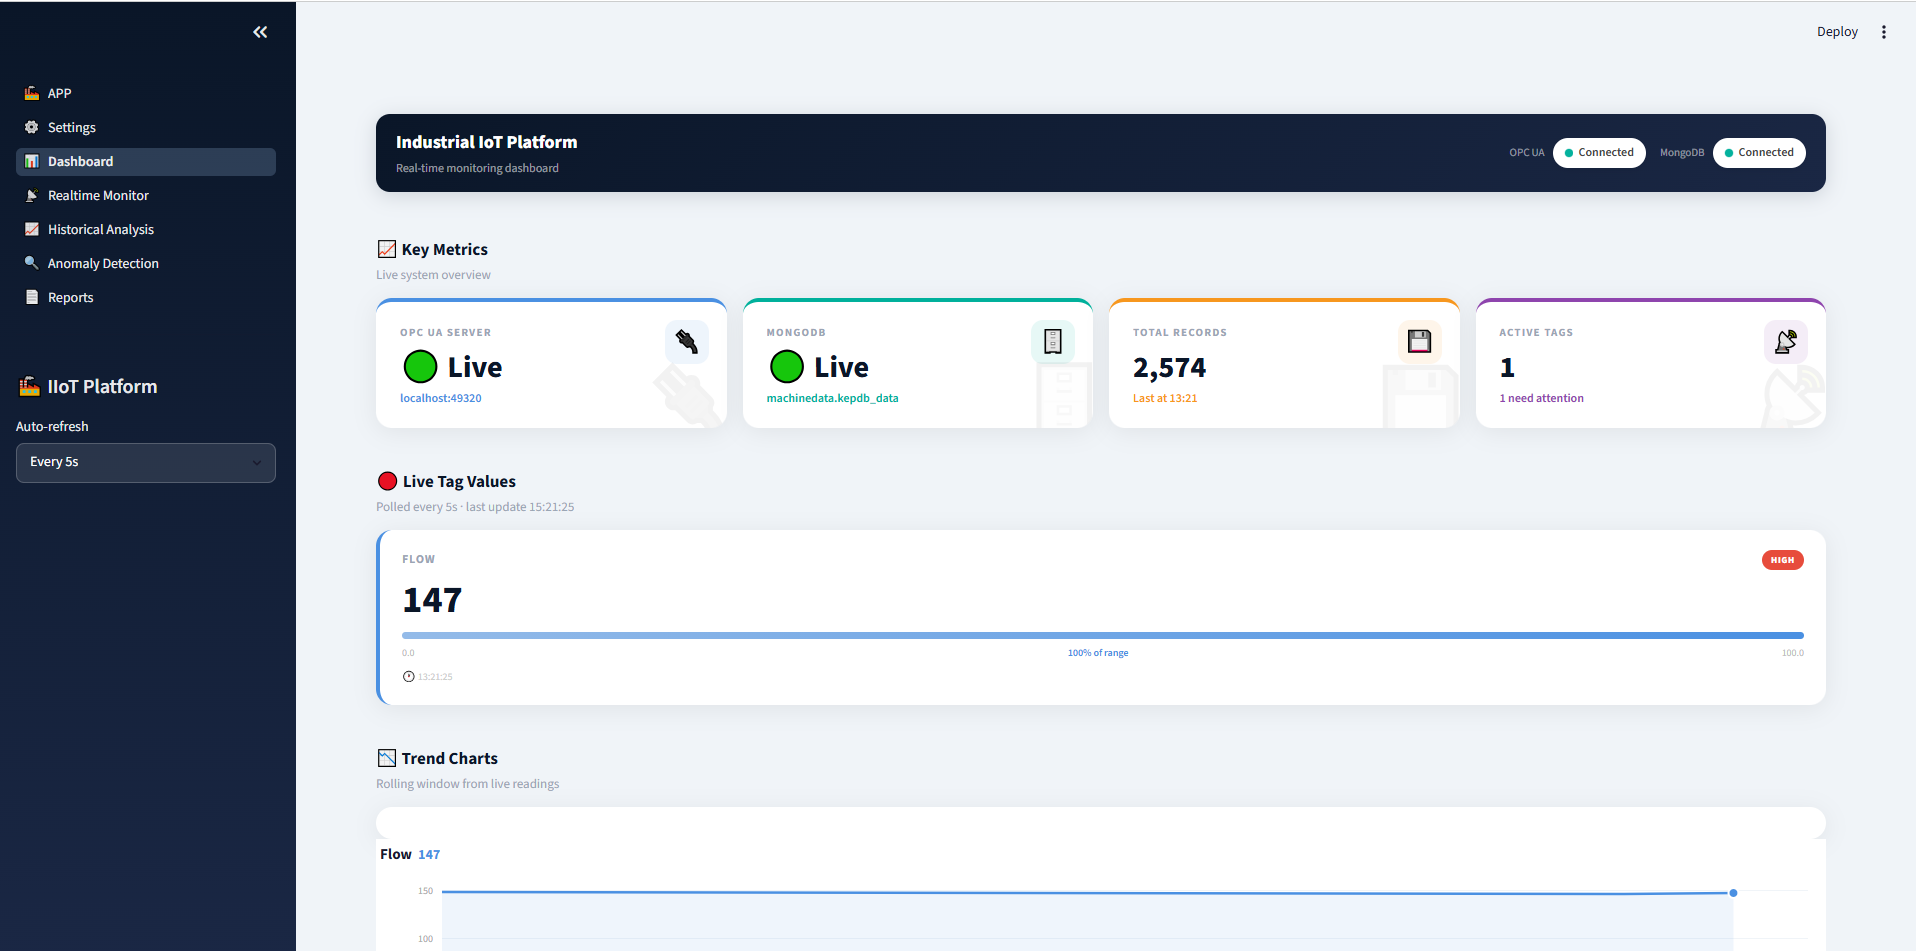
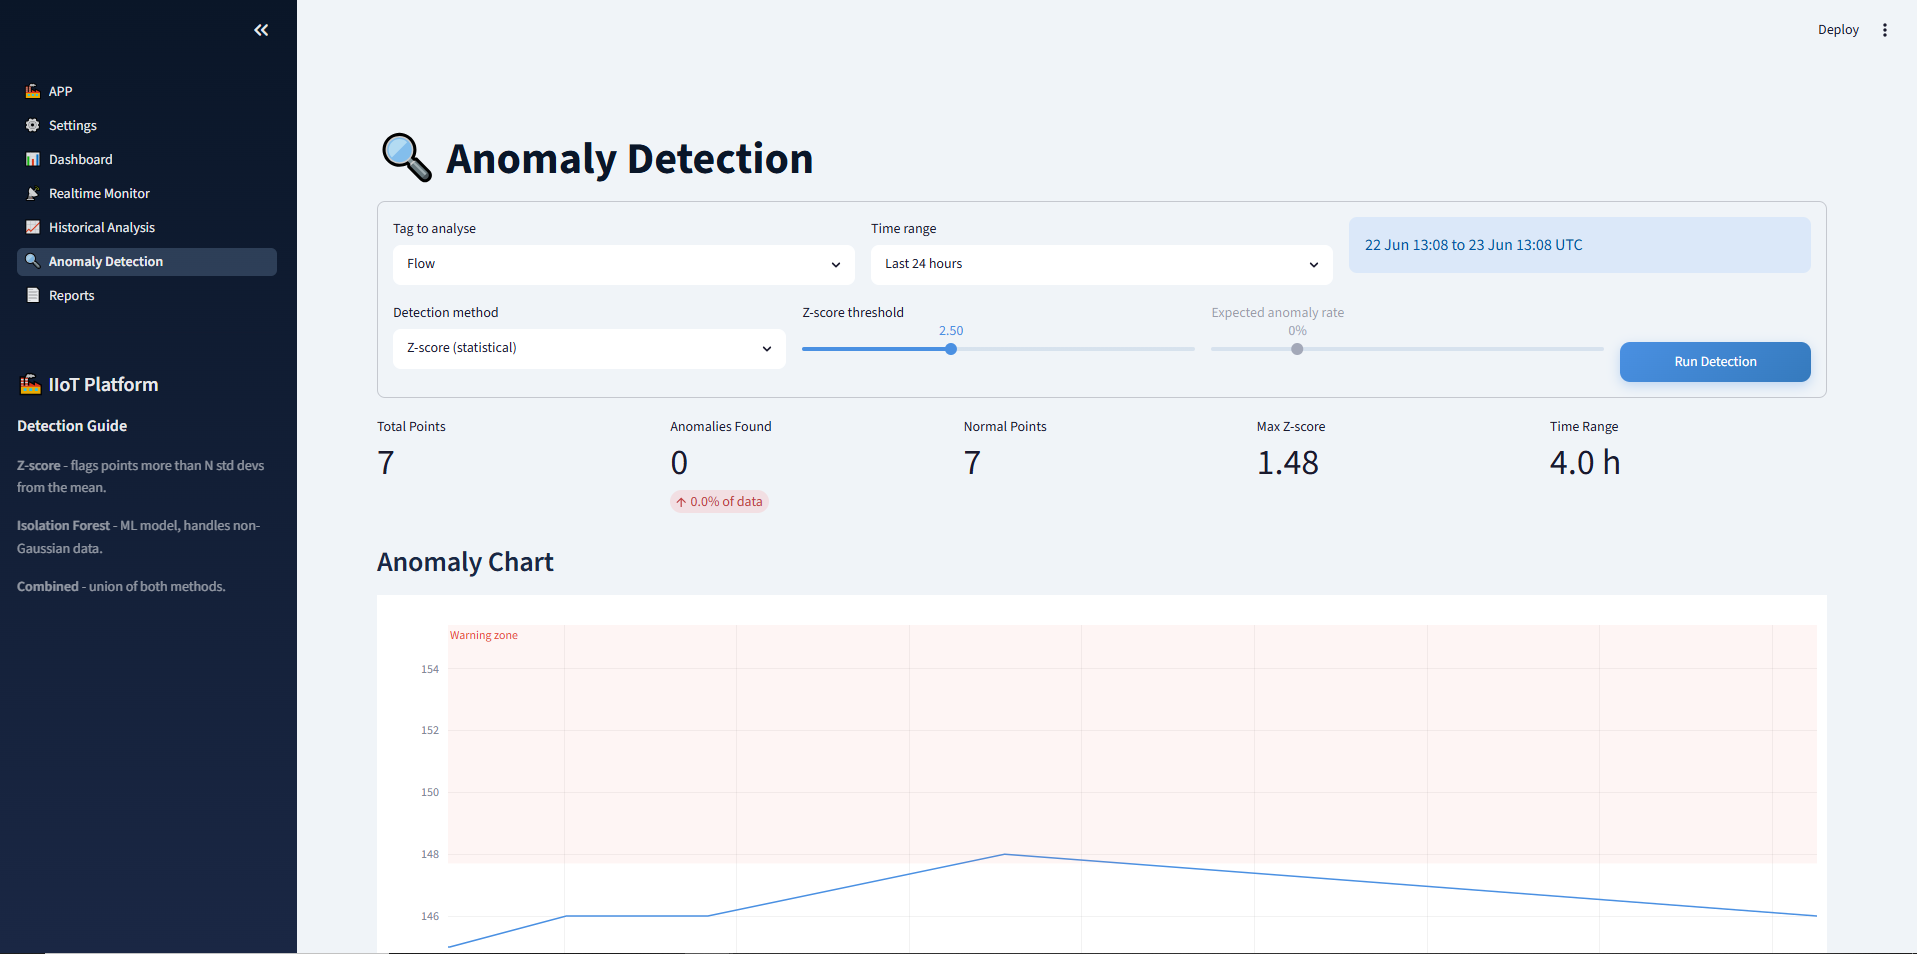
To make this concrete, here's what a modern plant-floor-to-cloud platform actually does day to day:
- Connect to any OPC UA server in seconds. Point it at your server, authenticate, and you're in. No custom drivers per device.
- Browse your entire tag database visually. See your whole address space as a tree and pick what matters — no typing out long tag paths by hand and hoping you got them right.
- Live dashboards. Watch every selected sensor value update in real time, the way you would at the HMI — except from anywhere.
- Historical queries. Pull any tag's history over any window, and export it to CSV when you need to hand it to someone or work it in a spreadsheet.
- Anomaly alerts. Set the bounds; get told automatically when a value goes out of range, instead of finding out at end of shift.
- Reports. Generate shareable summaries that a manager can actually read — not a raw data dump.
None of these are exotic. They're the things you already wish you had, delivered without the historian price tag.
Real-world use cases
The same pattern solves very different problems across industries:
- Food & beverage. Temperature and flow monitoring across filling lines, with alerts the moment a CIP cycle or a fill station drifts out of spec — the difference between catching a problem and scrapping a batch.
- Oil & gas. Pressure and level monitoring on remote tanks, visible from a central dashboard instead of a windscreen-time drive to a wellsite.
- Discrete manufacturing. Real OEE data pulled straight from CNC machines — cycle counts, downtime, availability — instead of a spreadsheet someone fills in from memory.
- Utilities. Energy consumption tracked per line, so you can actually see where the kilowatt-hours go and bill or optimize accordingly.
Different sensors, different stakes, same architecture: get the data off the floor, into a queryable store, in front of the people who can act on it.
Why this matters for Industry 4.0
You can't improve what you can't measure.
It's still true, and it's the whole case in a single sentence.
But there's a second reason this matters more now than it did five years ago. Every conversation about AI and machine learning on industrial data — predictive maintenance, optimization, anomaly detection — quietly assumes a precondition that most plants haven't met: the data has to already be in a structured, queryable store. You cannot run a model on data that's trapped in a PLC or scattered across paper logs. Getting plant data to the cloud isn't a nice-to-have on the road to AI. It's step one. Everything else is built on top of it.
This is also where the OT/IT gap finally gets bridged in a practical way. Operations technology — the controllers and sensors on the floor — meets information technology — the databases, dashboards, and eventually the models. For years those two worlds barely spoke. A clean pipeline from OPC UA to the cloud is the handshake between them.
Getting it running
The honest version, with no developer required to follow it: this kind of platform is open source, runs on any PC, and connects to the OPC UA servers you already have. There's no agent to install on every device and no protocol conversion project. You point it at your existing infrastructure and it reads what's already there.
The quickstart is genuinely about three steps — install, connect to your OPC UA server, browse and select your tags — and you're watching live data. No vendor lock-in, no per-tag licensing, no annual renewal that scales faster than your plant does.
What's next
Getting data to the cloud is the foundation, not the destination. Once it's there, the things that used to require a major project become incremental:
- Predictive maintenance — moving from "react when it breaks" to detecting the signature of a failure before it happens.
- Mobile alerts — a message to your phone or inbox the moment a tag goes out of range, so the line doesn't wait for someone to notice.
- AI chat over your plant data — asking, in plain English, "why did line 3 trip last night?" and getting an answer grounded in your actual history, not a guess.
Each of those is a layer on top of the same simple pipeline. Build the foundation right — get your data off the floor and into a place it can be used — and the rest stops being a moonshot and starts being a roadmap.
The machines have been talking for years. It's time to listen — and you don't need an expensive historian to start.
Written by Usman Nasir — control systems engineer, Stockholm.